Response Time - Documentation
The most basic performance metric

How to track Response Time of a website?
The HTTP Monitor automatically tracks the response times for a URL. All you need to do is Add an HTTP Monitor. To see the response times follow these steps:-
- Goto the Monitors Area by selecting it from the left sidebar
- Click on an appropriate Status from the left
- Find your monitor and click on it to see it's detail
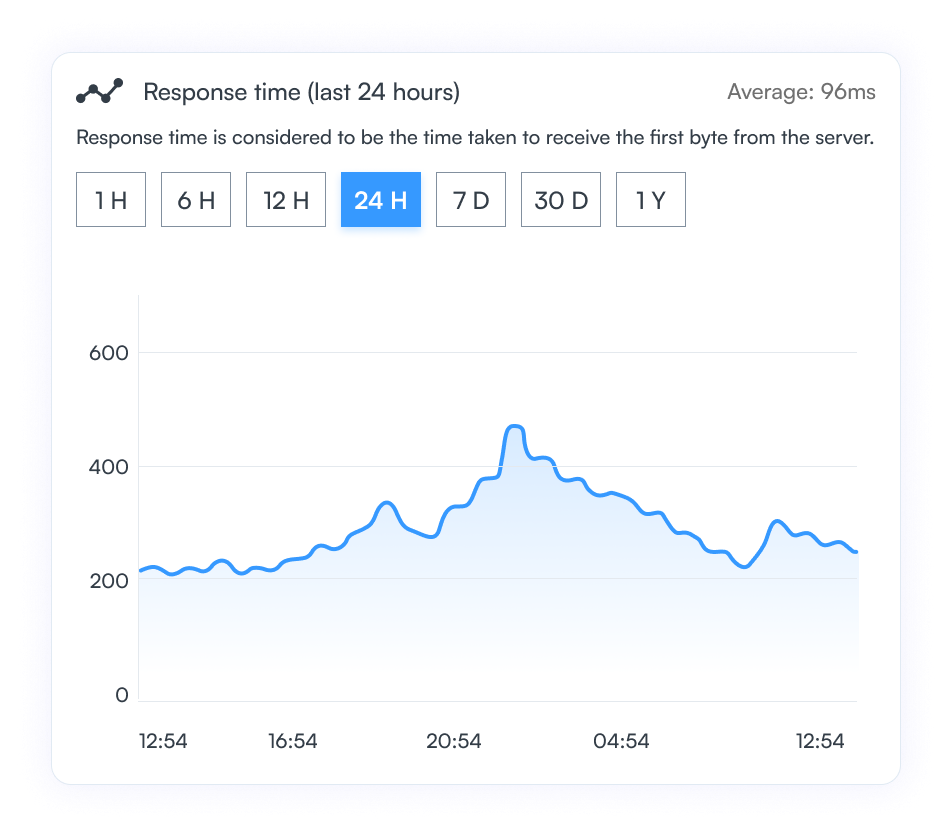
- You can see a line chart that shows the response time for the last 24 hours (by default)
- The average response time for the period is also listed
- Click on any of the buttons on the top left (1H, 6H, 12H, etc) to select the date and time range for which you want to see the response times
Page Response Time Graph
Given below is a sample response time graph for a web page. The X-axis represents the timestamp when the response time was measured. The Y-axis represents the response time measured in milliseconds. You can use the buttons labeled 1H, 6H, etc to switch the time range for the uptime graph. At the top right corner is the average response time for the time period you selected.